Ecolens observes your entire asset, period after period: satellite passes cover every kilometer, and geospatial or field data join in when the case demands them. Not one hectare goes unwatched, no matter the size.
Every image feeds the case's analyses — vegetation, trend, condition — and every unit of the asset gets a 0–100 priority with its evidence. Your whole territory, ordered by urgency.
The ranking turns into directed action: resources go to the critical points before problems grow, and every decision is backed by evidence before management, auditors or the regulator.
One technology. Every territory under observation.
Ecolens masters a single discipline: territory. The same prioritization logic, with the analyses each use case demands.
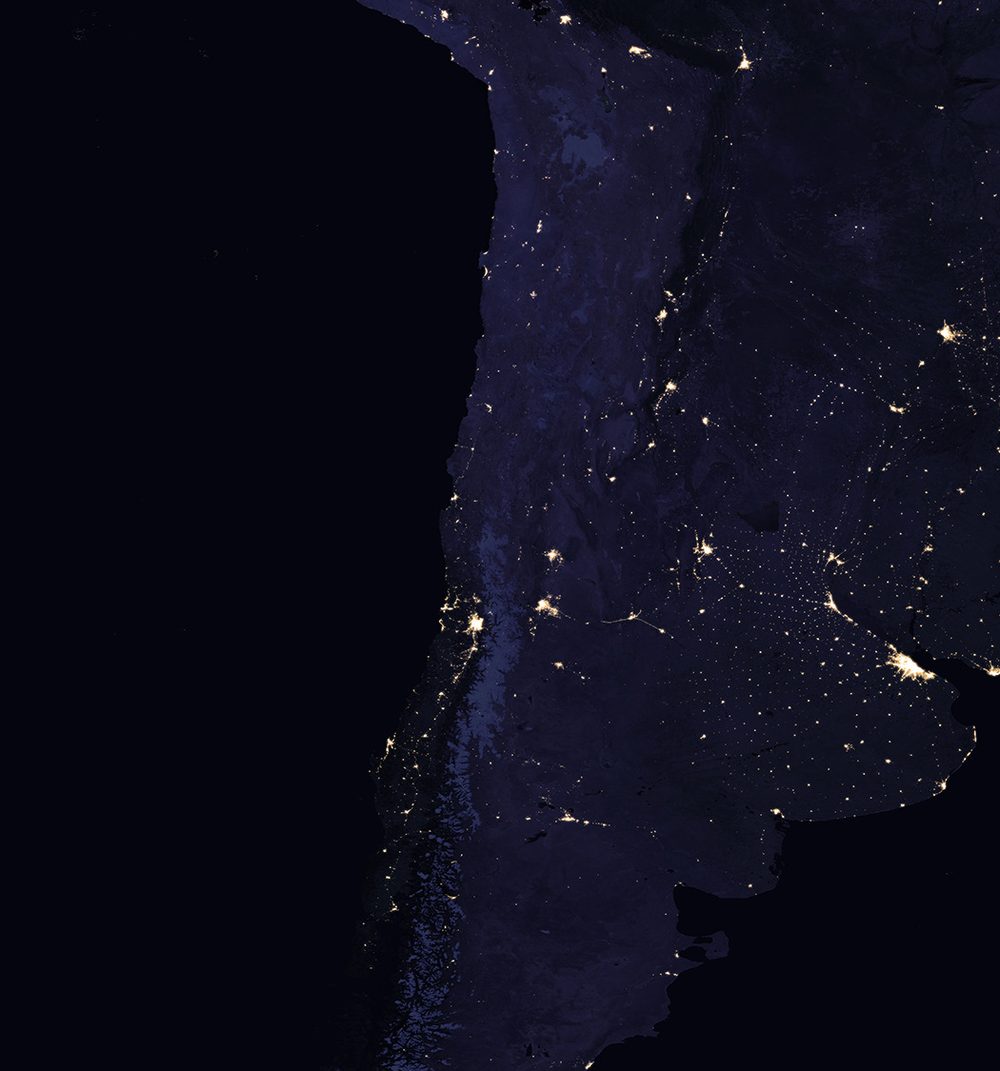
Power lines
Ecolens watches the whole corridor — vegetation, wildfires, towers, land-cover change — and orders spans by inspection urgency. Every period, the field crew gets its work queue and the company gets the compliance backing regulators demand.
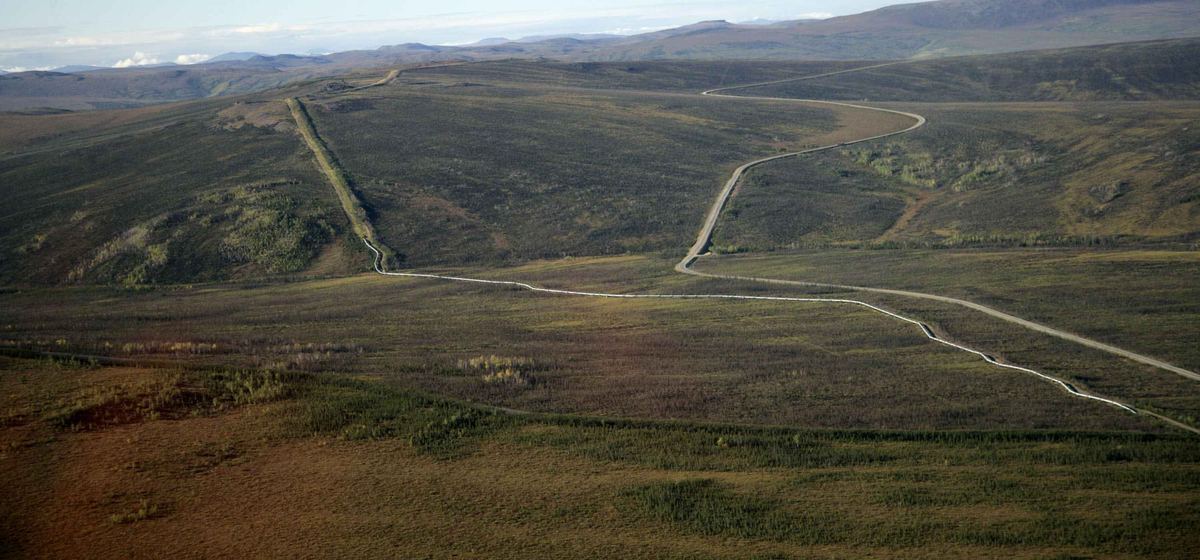
Oil & gas pipelines
Along the pipeline right-of-way, Ecolens detects vegetation, wildfires, third-party encroachment and land-cover change. The same span logic prioritizes the points that need field verification.
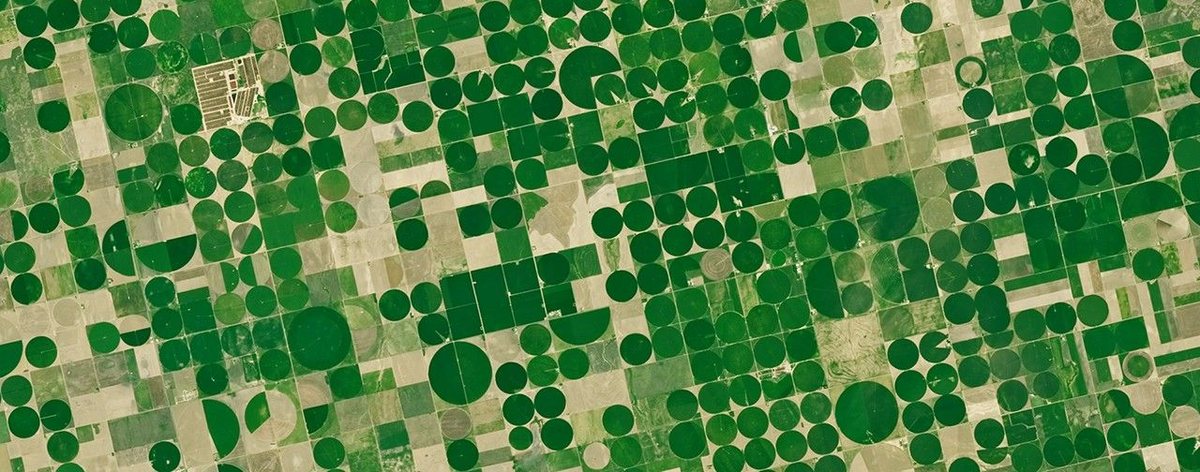
Agriculture
Ecolens follows every field season after season: it measures crop vigor, detects lagging zones within the farm and shows the trend, to guide management with data.
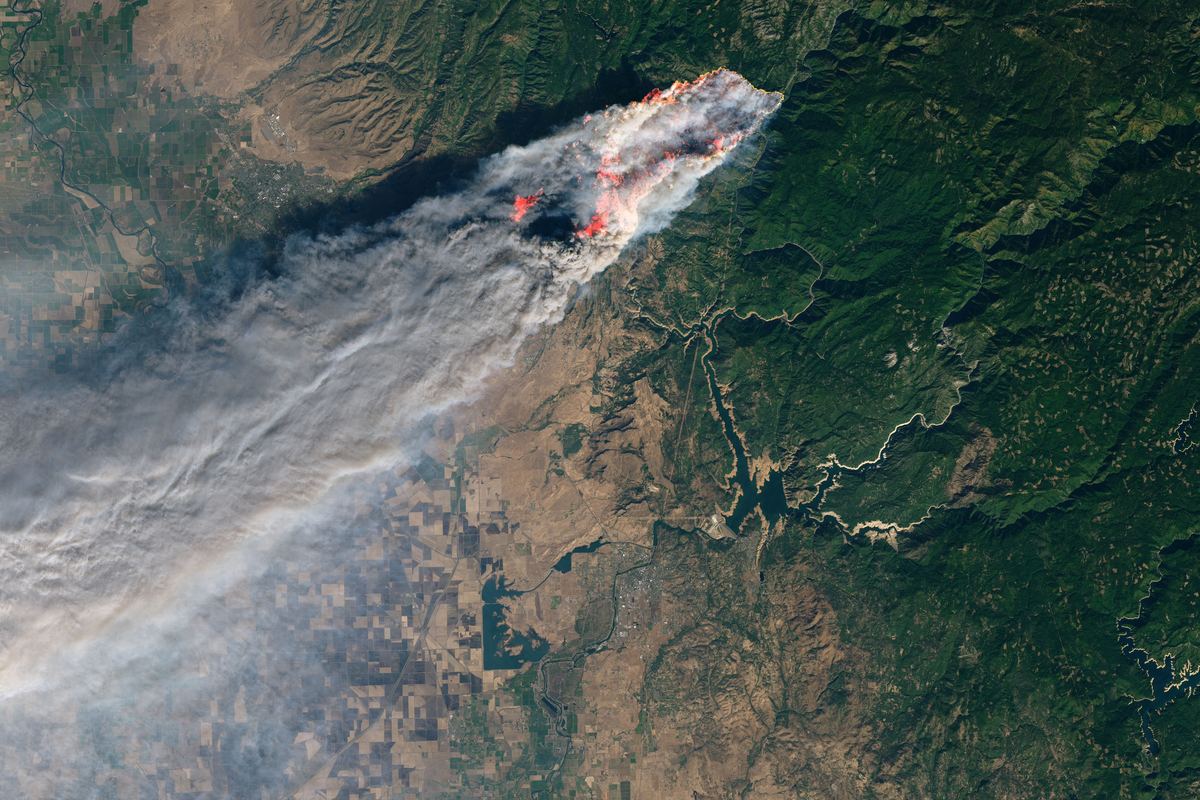
Forestry assets
Ecolens watches the estate and its surroundings: dry-fuel build-up, burn scars and land-use change. Analyses become concrete priorities to protect the forest.
Flagship case · Power lines
The critical spans first, without walking the whole line.
This is the real Tiltil–Limache 2×110 kV corridor, with demo data: from satellite pass to inspection ranking, step by step.
Inspection queue · January 2026
Inspection priority (satellite proxy) — not electrical risk nor a pruning order.
01 · The source
The whole grid, seen from above
Every Sentinel-2 pass covers the entire corridor, period after period. Total visibility no longer depends on flyovers and patrols.
02 · The unit of analysis
The corridor is split into comparable spans
Tower to tower, each span receives its analyses: vegetation, trend, condition and valid coverage for the period.
03 · The context
The monitoring buffer
Ecolens draws a 30 m analysis strip on each side of the line to prioritize inspection. It is not the regulatory safety strip, and it does not measure clearance.
Buffer ≠ regulatory clearance strip04 · The decision
Priority per span, with evidence
Every span enters the period's ranking with its priority and its evidence. Color indicates priority; confidence is declared separately.
The cost of looking late
The law already demands constant monitoring. Walking the line can't deliver it.
Chile's (art. 4.11) requires constant monitoring of corridor vegetation, and the Supreme Court has held utilities liable even for third-party trees outside the strip (). The grid is vast; field budgets and time are not.
typical fines for corridor vegetation
sanction processes open across the power sector
civil lawsuit over a vegetation-related failure
- ISA InterChile180.000
- Transelec80.000
- Alfa50.000
How the data reaches your desk
“Vegetation across 64% of the 30 m operational buffer on span T120–T121, with a rising trend and dry condition. Inspection priority: 76/100. Confidence: high.”
What it is — and isn't. This priority orders inspection using satellite data — it is a . It does not measure the nor authorize pruning. And the is not the .
From a satellite image to a priority per span.
We observe your entire asset
We pick the right source for each case: high-frequency satellite, geospatial data or dedicated surveys. Cost doesn't scale with kilometers.
We compute indicators on every span
The asset is split into comparable spans. On each one, the case's analyses compute their indicators — spectral indices like NDVI — for the period.
Vegetation · Wildfires · Towers · Land-cover change · Environmental crossings
We prioritize with evidence
Every span gets a 0–100 priority with its full backing: the source image, the valid coverage and the confidence of the estimate.
Priority and confidence are different things — and are shown separately.
We never lower a priority for lack of data: uncertainty is declared. And under clouds, is never reported as “no risk”.
76/100
priority inspectionMedium
partial coverage (clouds)
Pilot
Start with a real asset. Verify the ranking over your territory.
For many assets the geometry is public and the satellite is open: we can arrive at the first meeting with your territory already analyzed.
- 01
We pick a real asset with you
It can be a line, a farm or an area — whichever you define.
- 02
We analyze and prioritize
With real data, we deliver the ranking and its backing.
- 03
We review together
We review hits, false positives and false negatives with your specialists: their knowledge of the territory calibrates the analysis.